

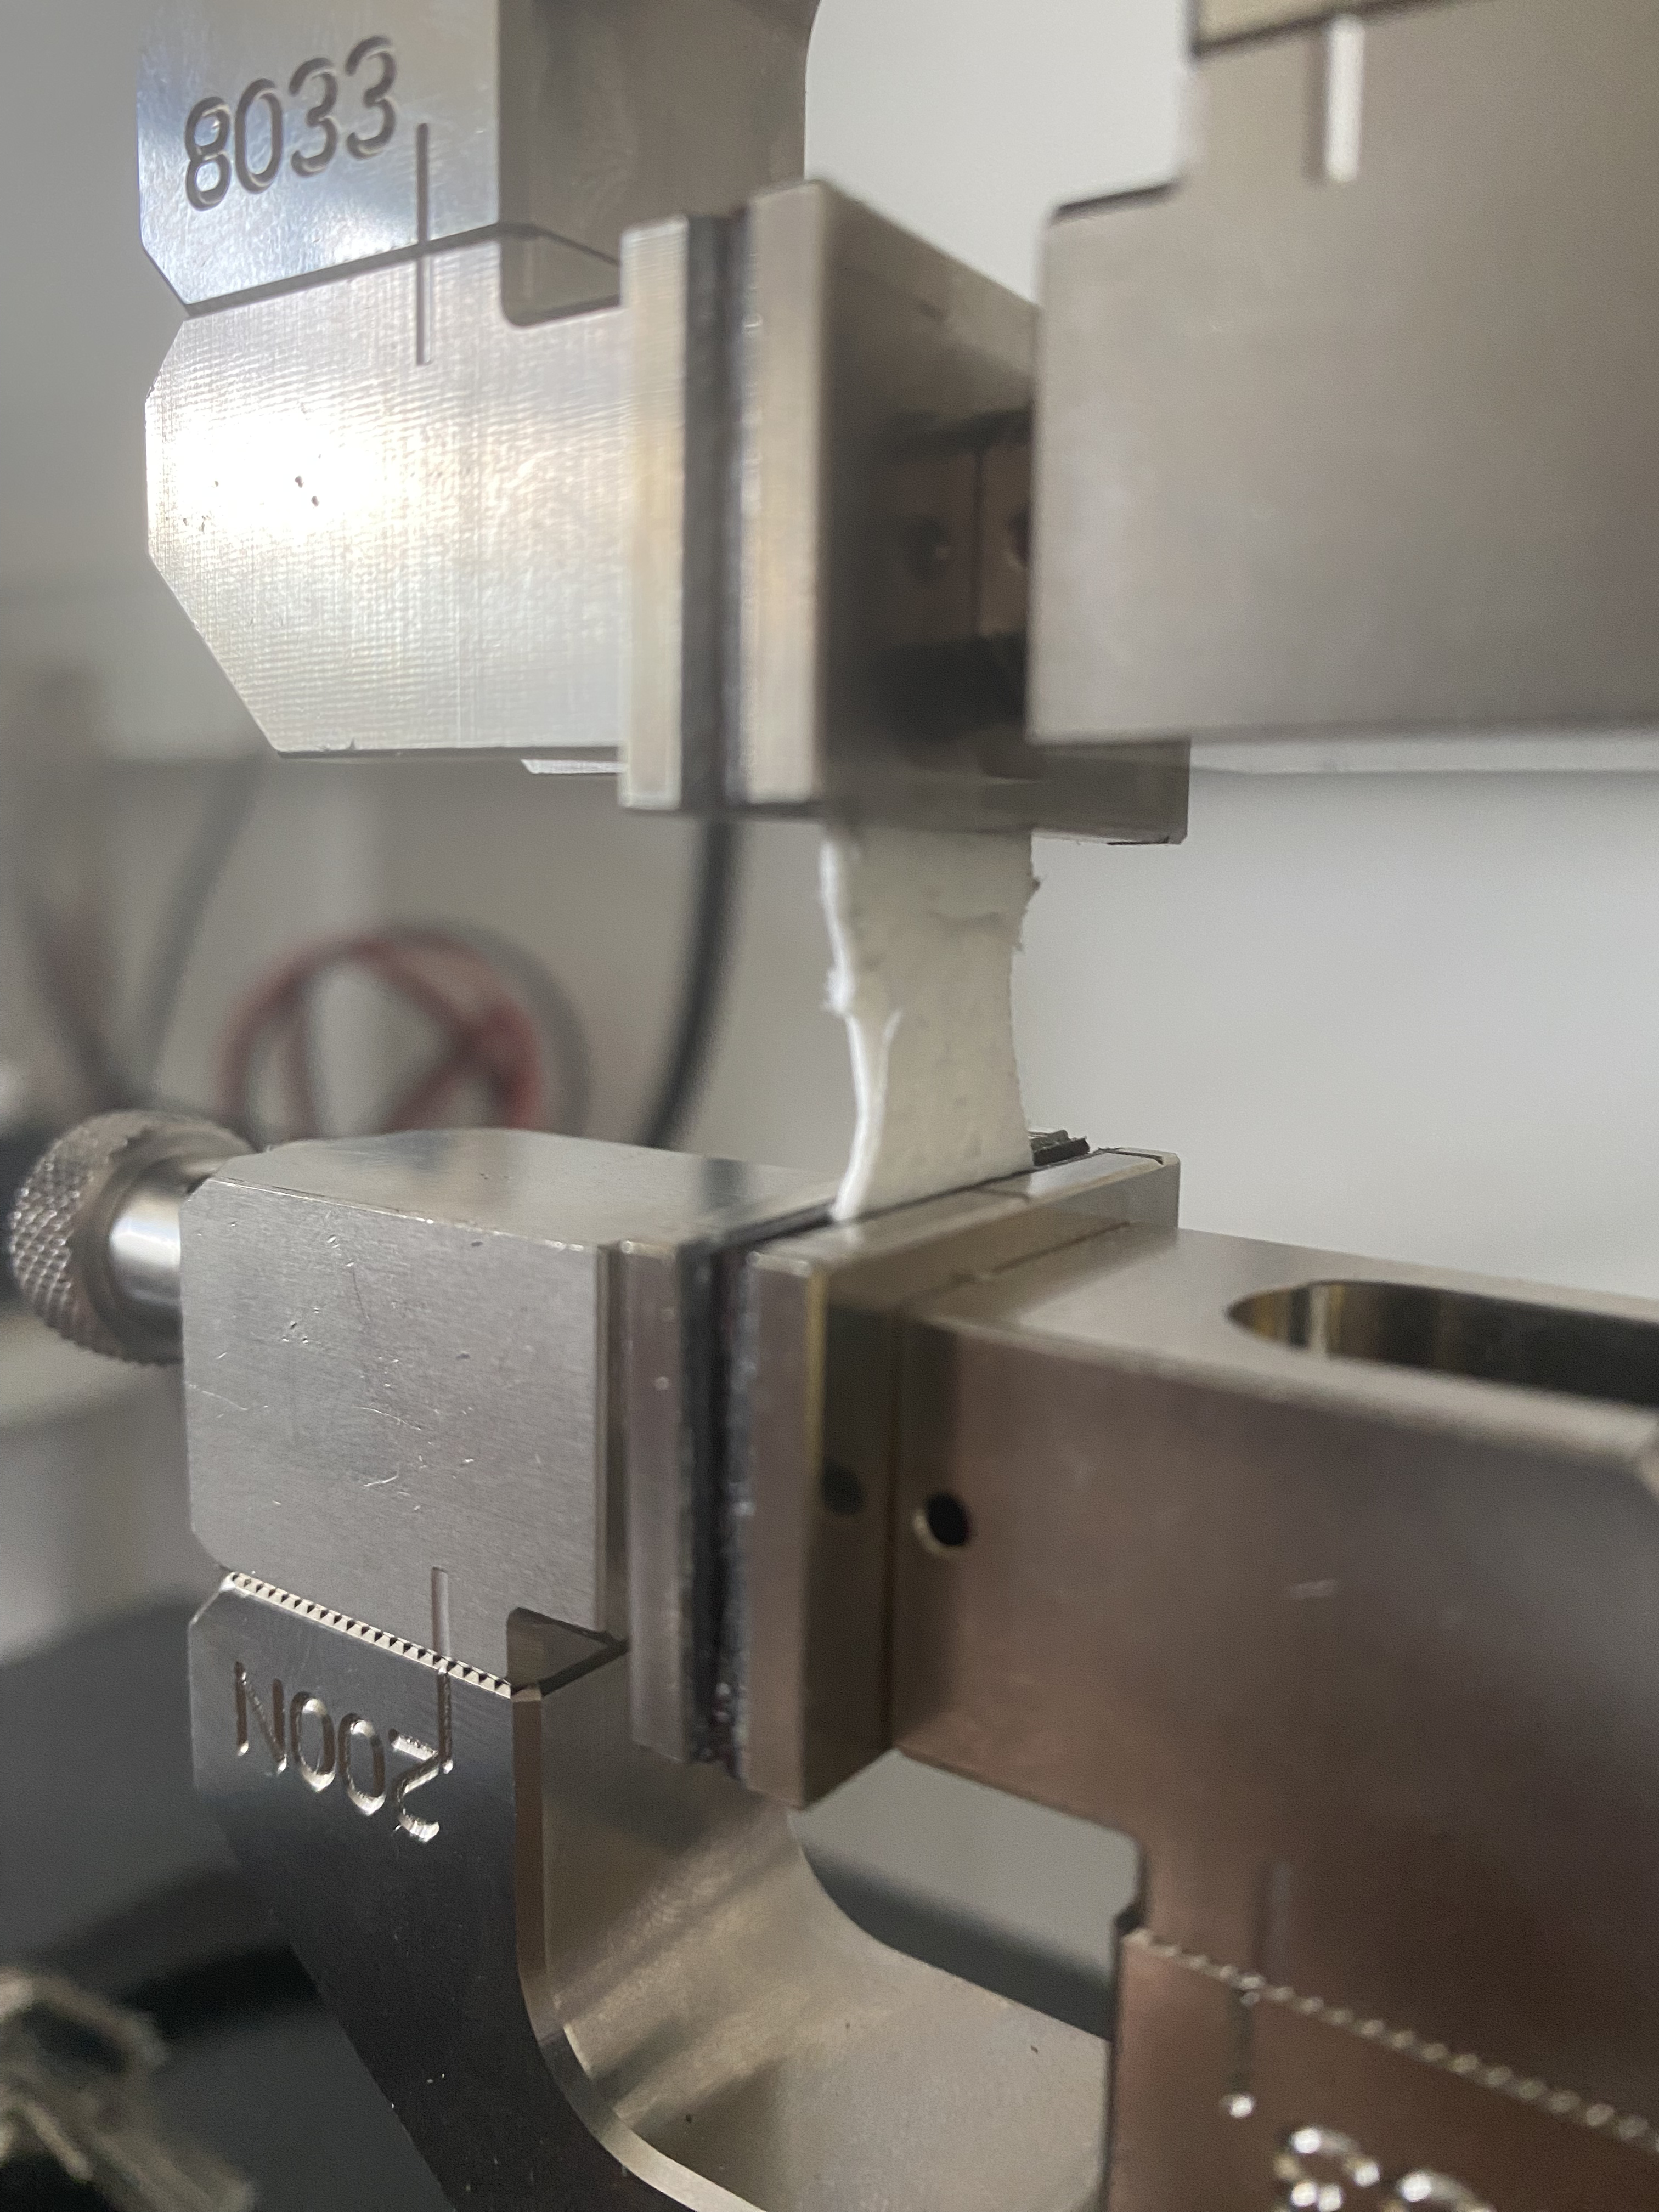
Tensile testing, also known as tension testing, is a fundamental materials science and engineering test in which a sample is subjected to a controlled tension until failure. Properties that are directly measured via a tensile test are ultimate tensile strength, breaking strength, maximum elongation and reduction in area. From these measurements the following properties can also be determined: Young's modulus, Poisson's ratio, yield strength, and strain-hardening characteristics.
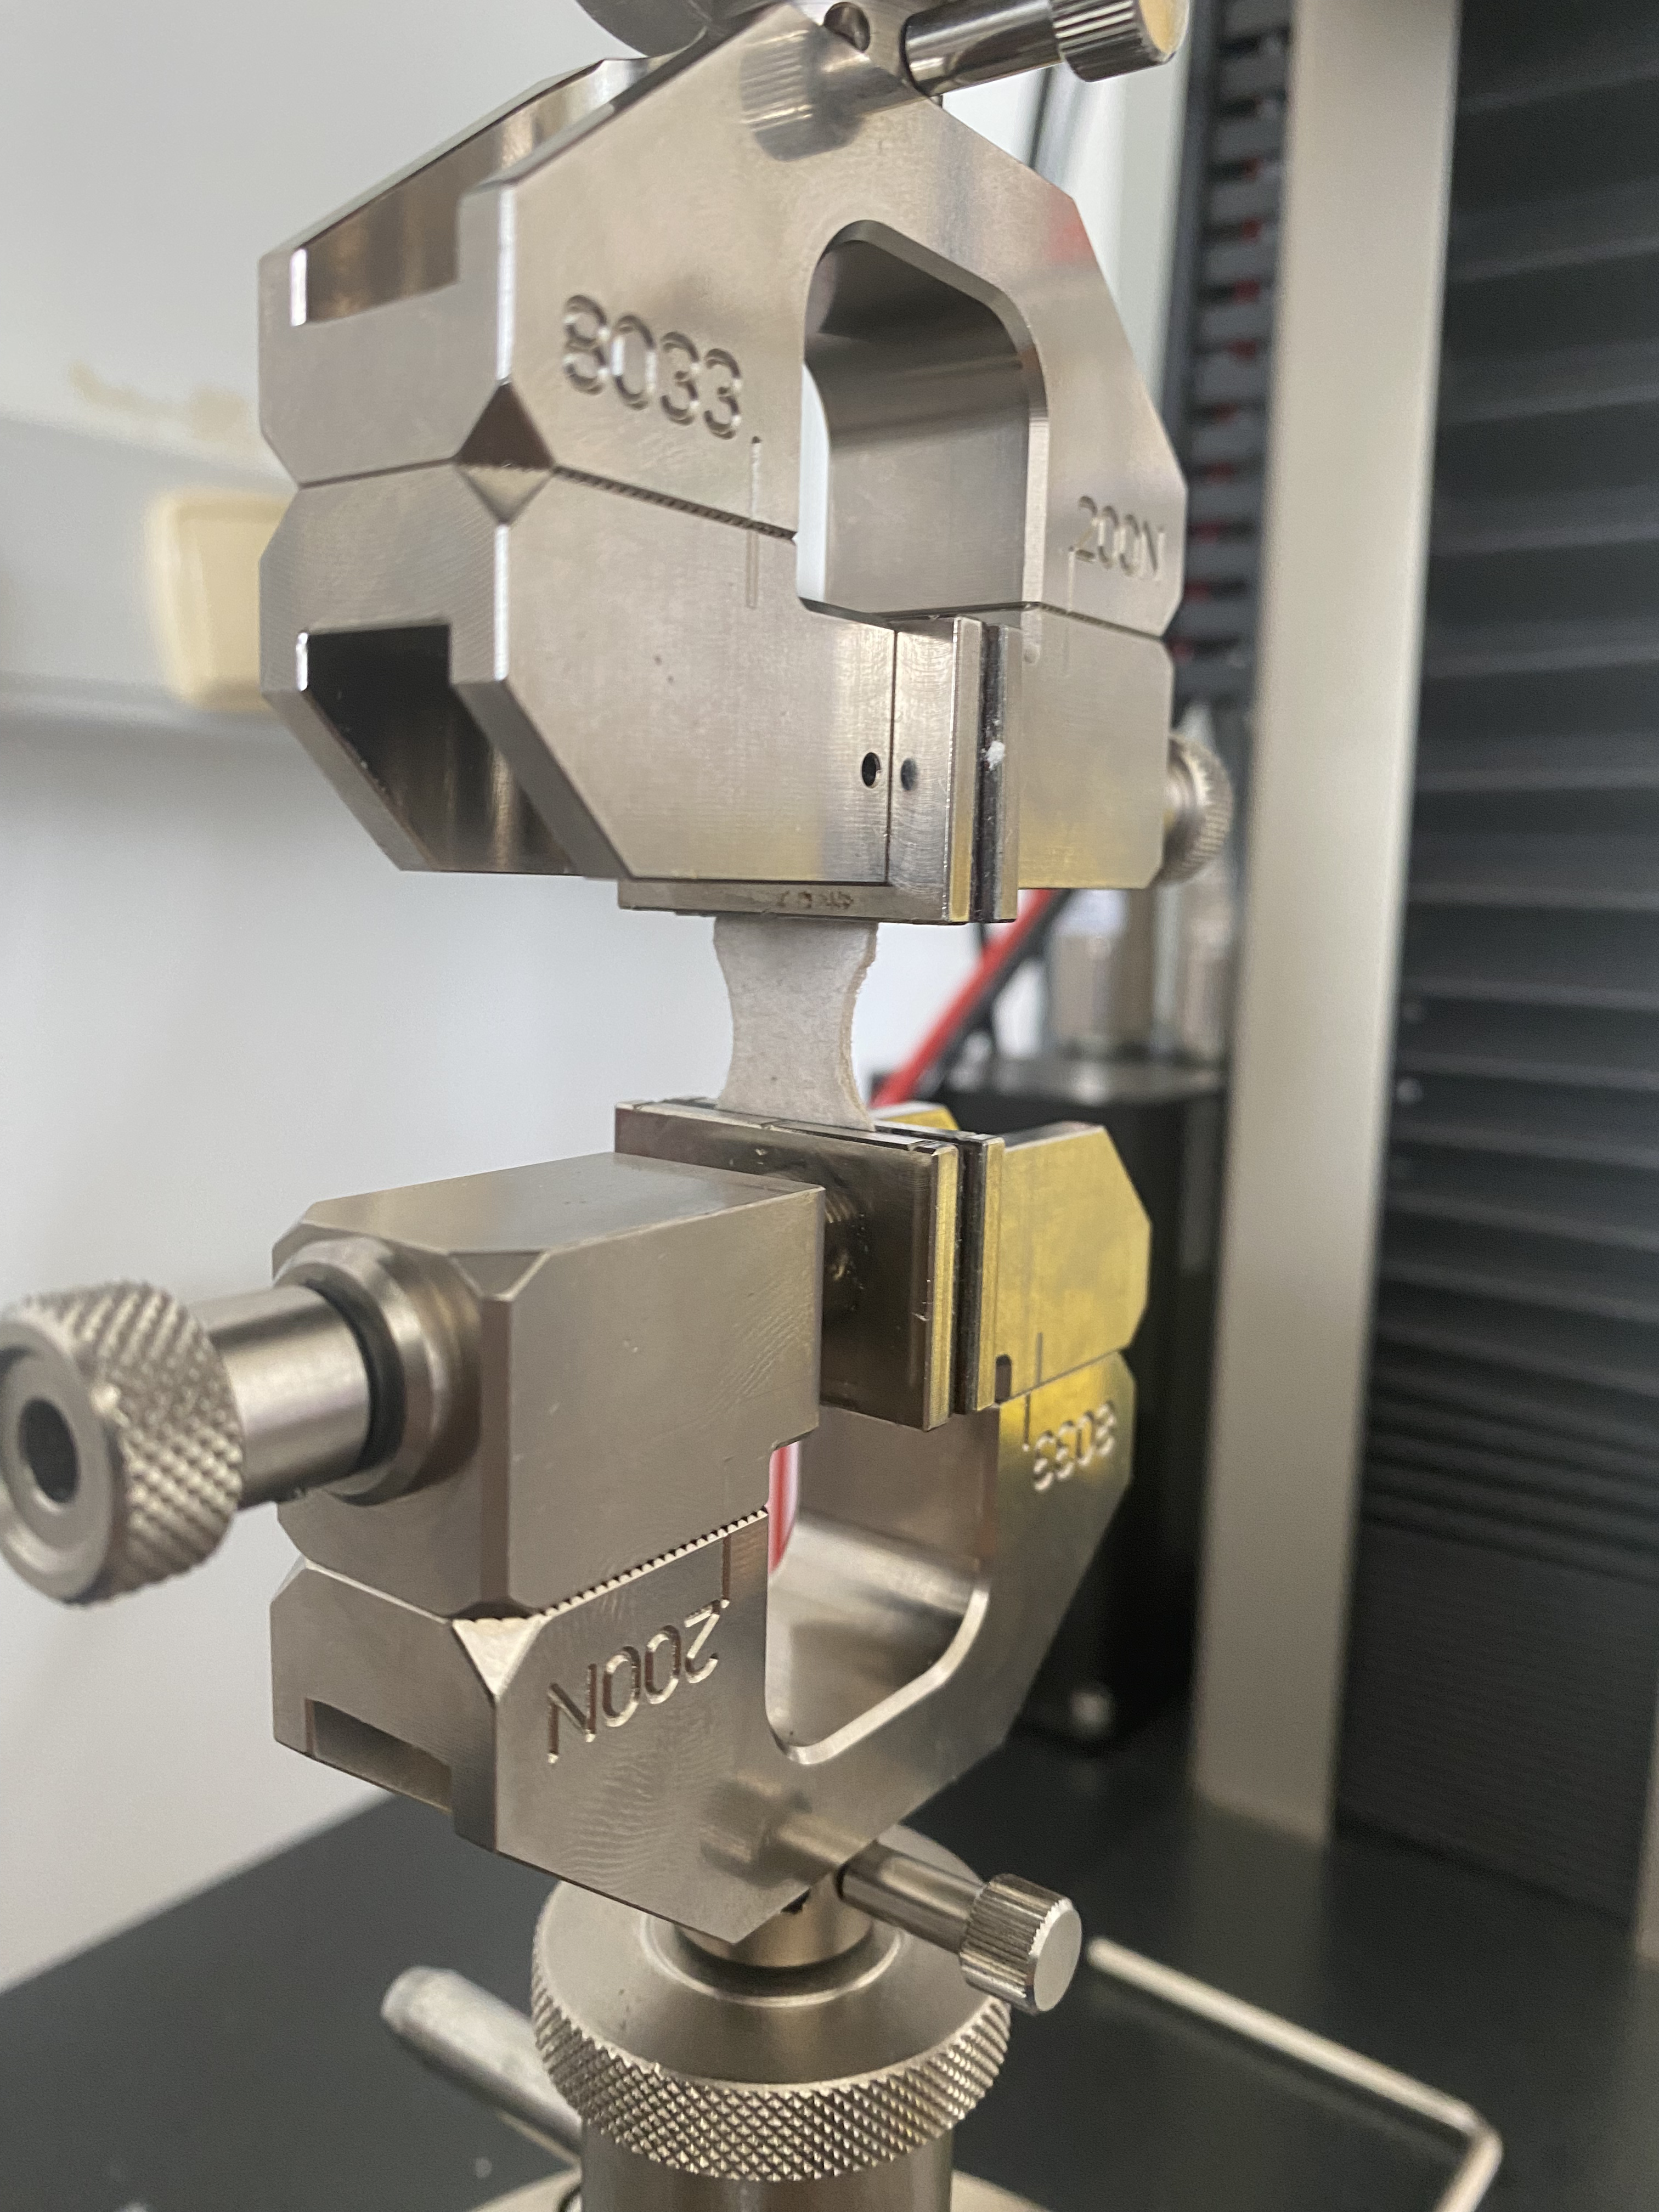
Uniaxial tensile testing is the most commonly used for obtaining the mechanical characteristics of isotropic materials. Some materials use biaxial tensile testing. The main difference between these testing machines being how load is applied on the materials.
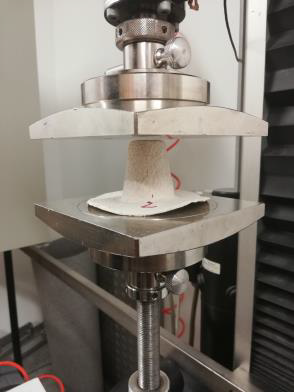
The purpose of the first experimental part was to conduct a compression test of the sample pots for both analysed configurations with to determine pot material properties. The pot was placed between the jaws of a tensile-compression device and then measured the reaction force on the upper jaw versus displacement of the jaws.
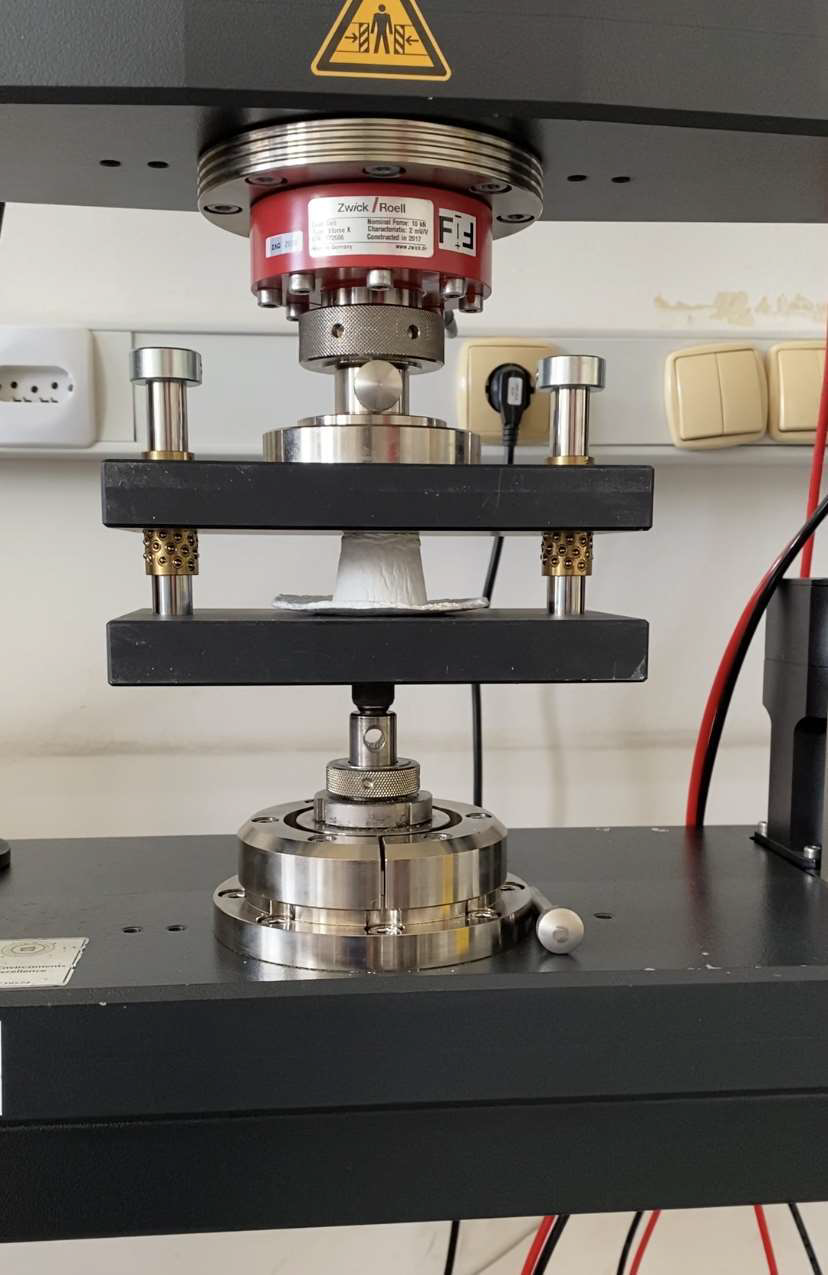
During a compression test, the applied force and the resulting deformation are analysed to indirectly determine the material's mechanical properties. Initially, in the elastic region, the material undergoes reversible deformation, where it can return to its original form once the force is removed. As the force increases, the material enters the plastic region, where the deformation becomes permanent. Understanding this force-deformation relationship is vital as it helps in predicting how the pulp material would behave under various stress conditions. It is essential to note that the specific force-deformation characteristics can vary based on the properties of the pulp material, including its density, fibre orientation, and moisture content.
Cushioning of packaging materials is typically evaluated in terms of the maximum deceleration versus the static stress for a specific drop height and cushion thickness. This enables one to obtain cushioning curve that defines minimum cushioning area to obtain best shock absorption. These standard methods provide a general guidance to the evaluation of cushioning performance. Here the standard impact-based test facility is proposed as shown in the figure below.
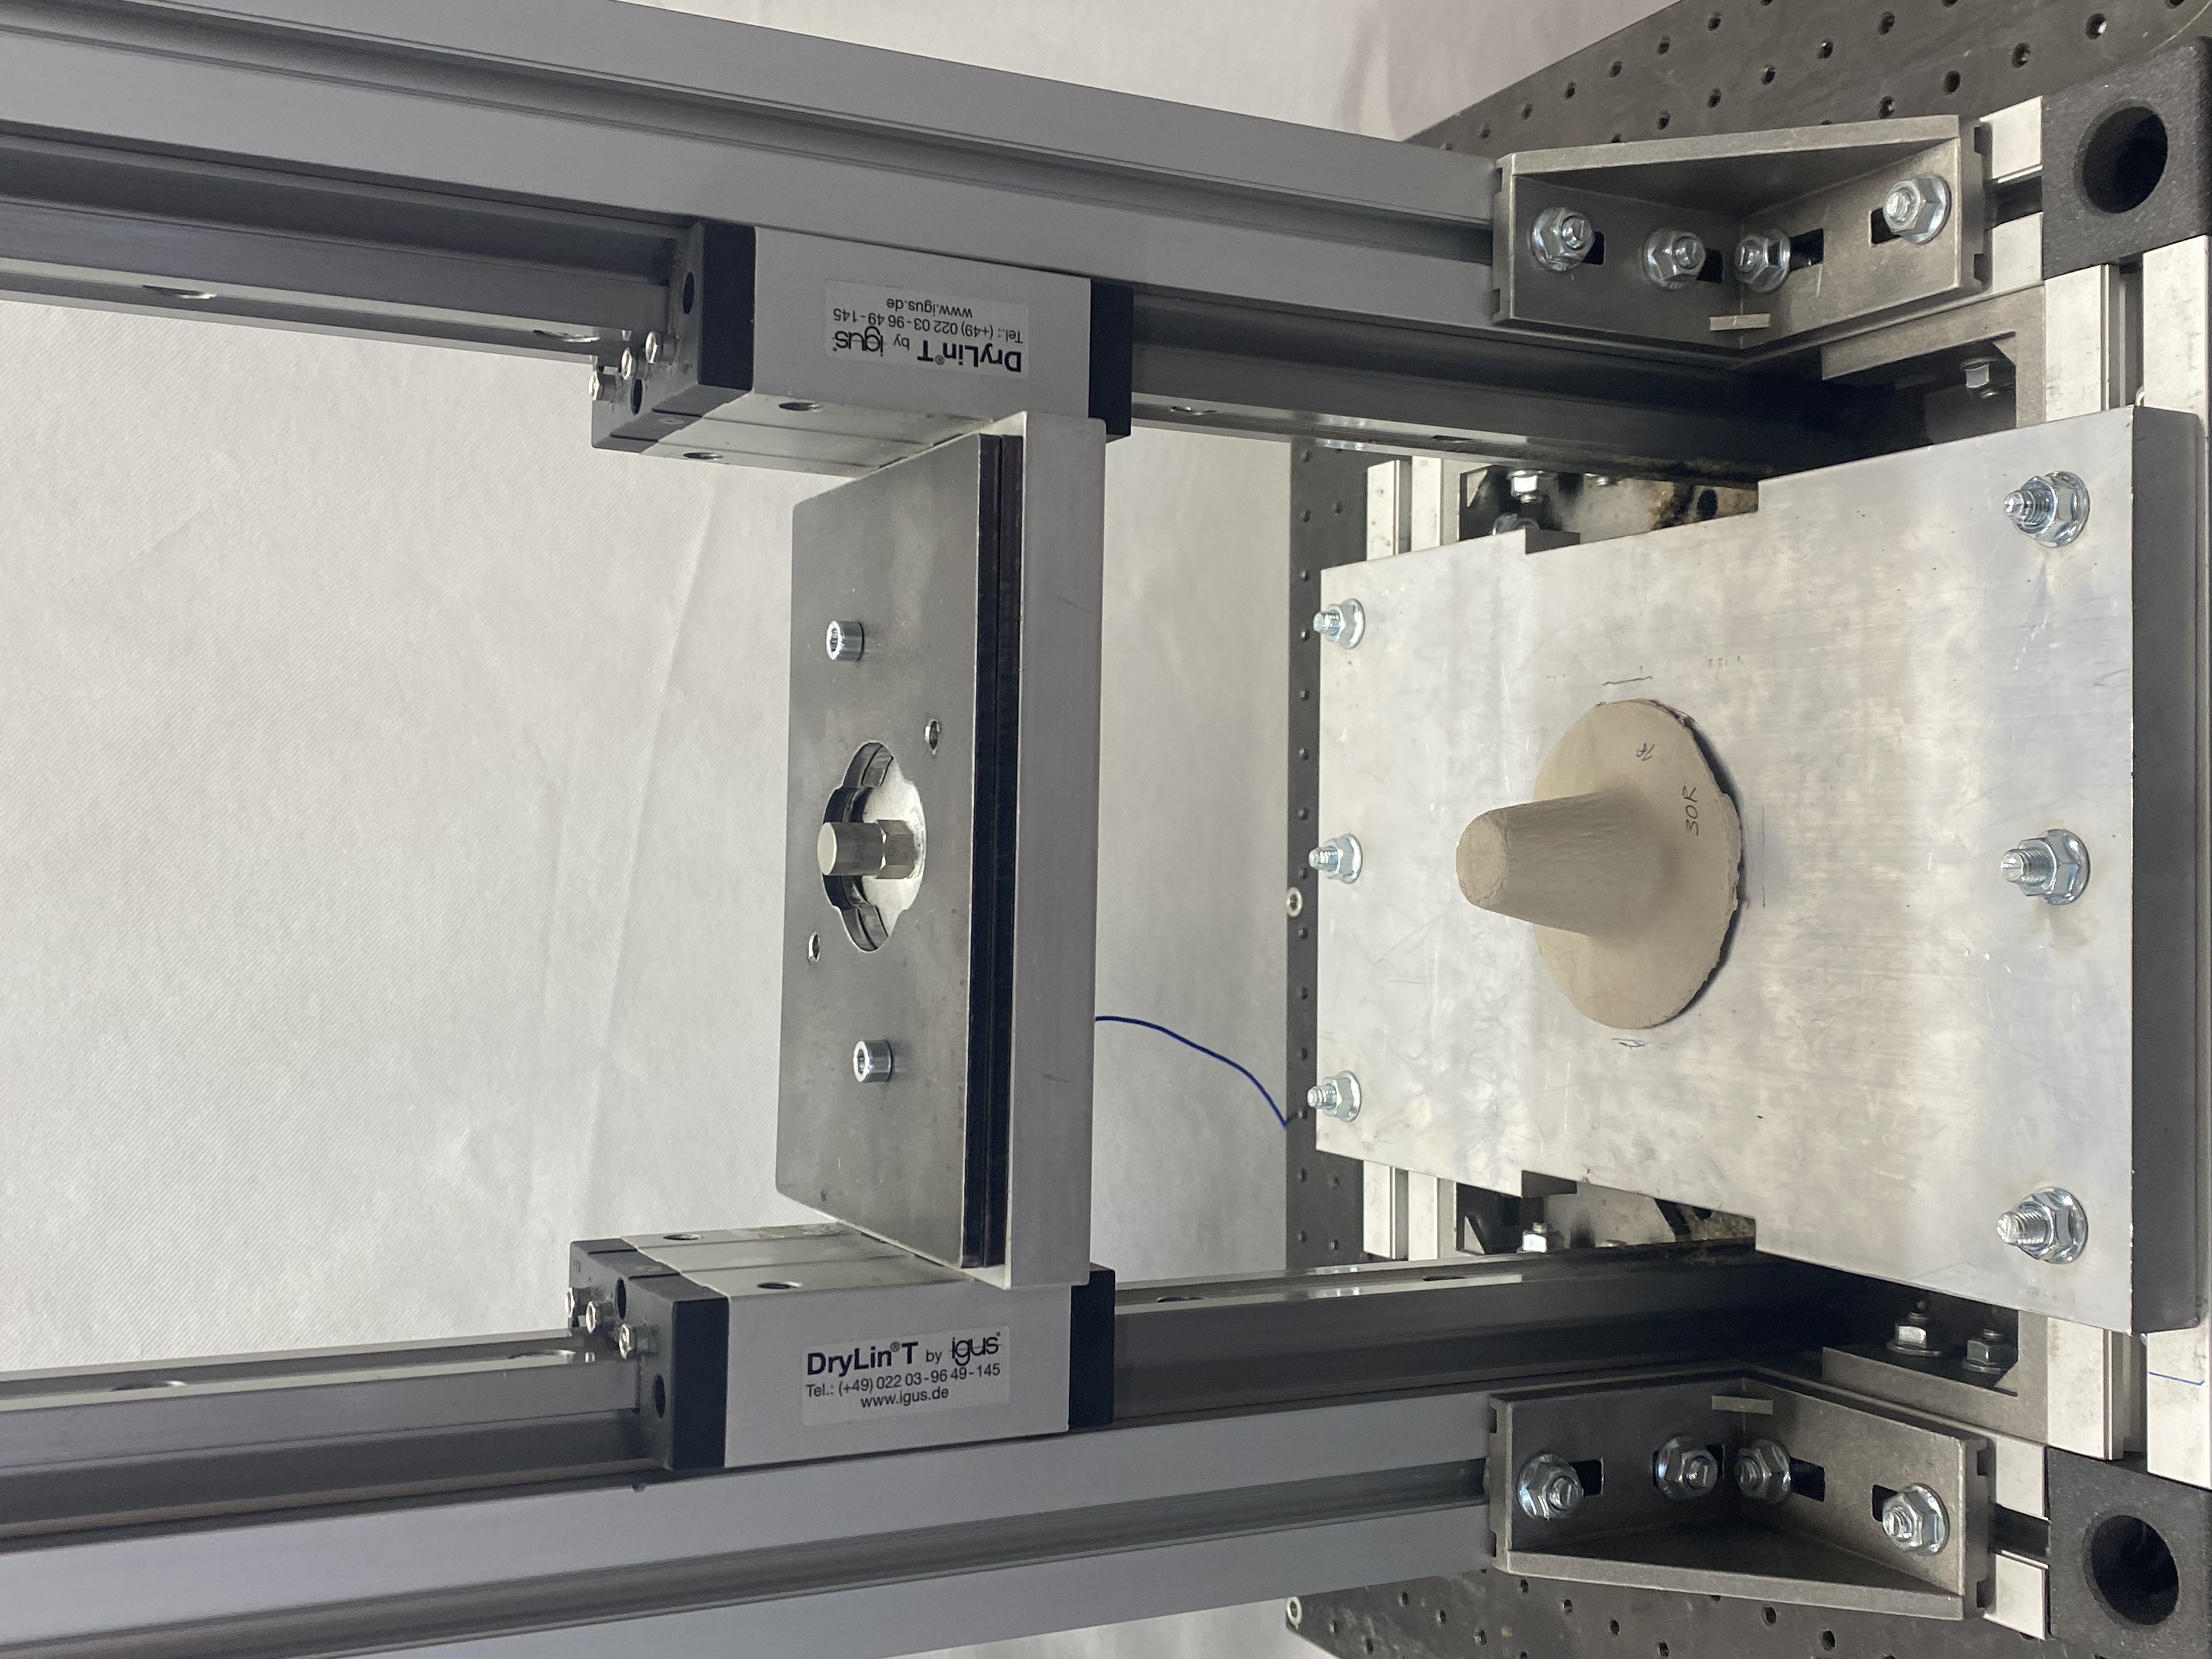
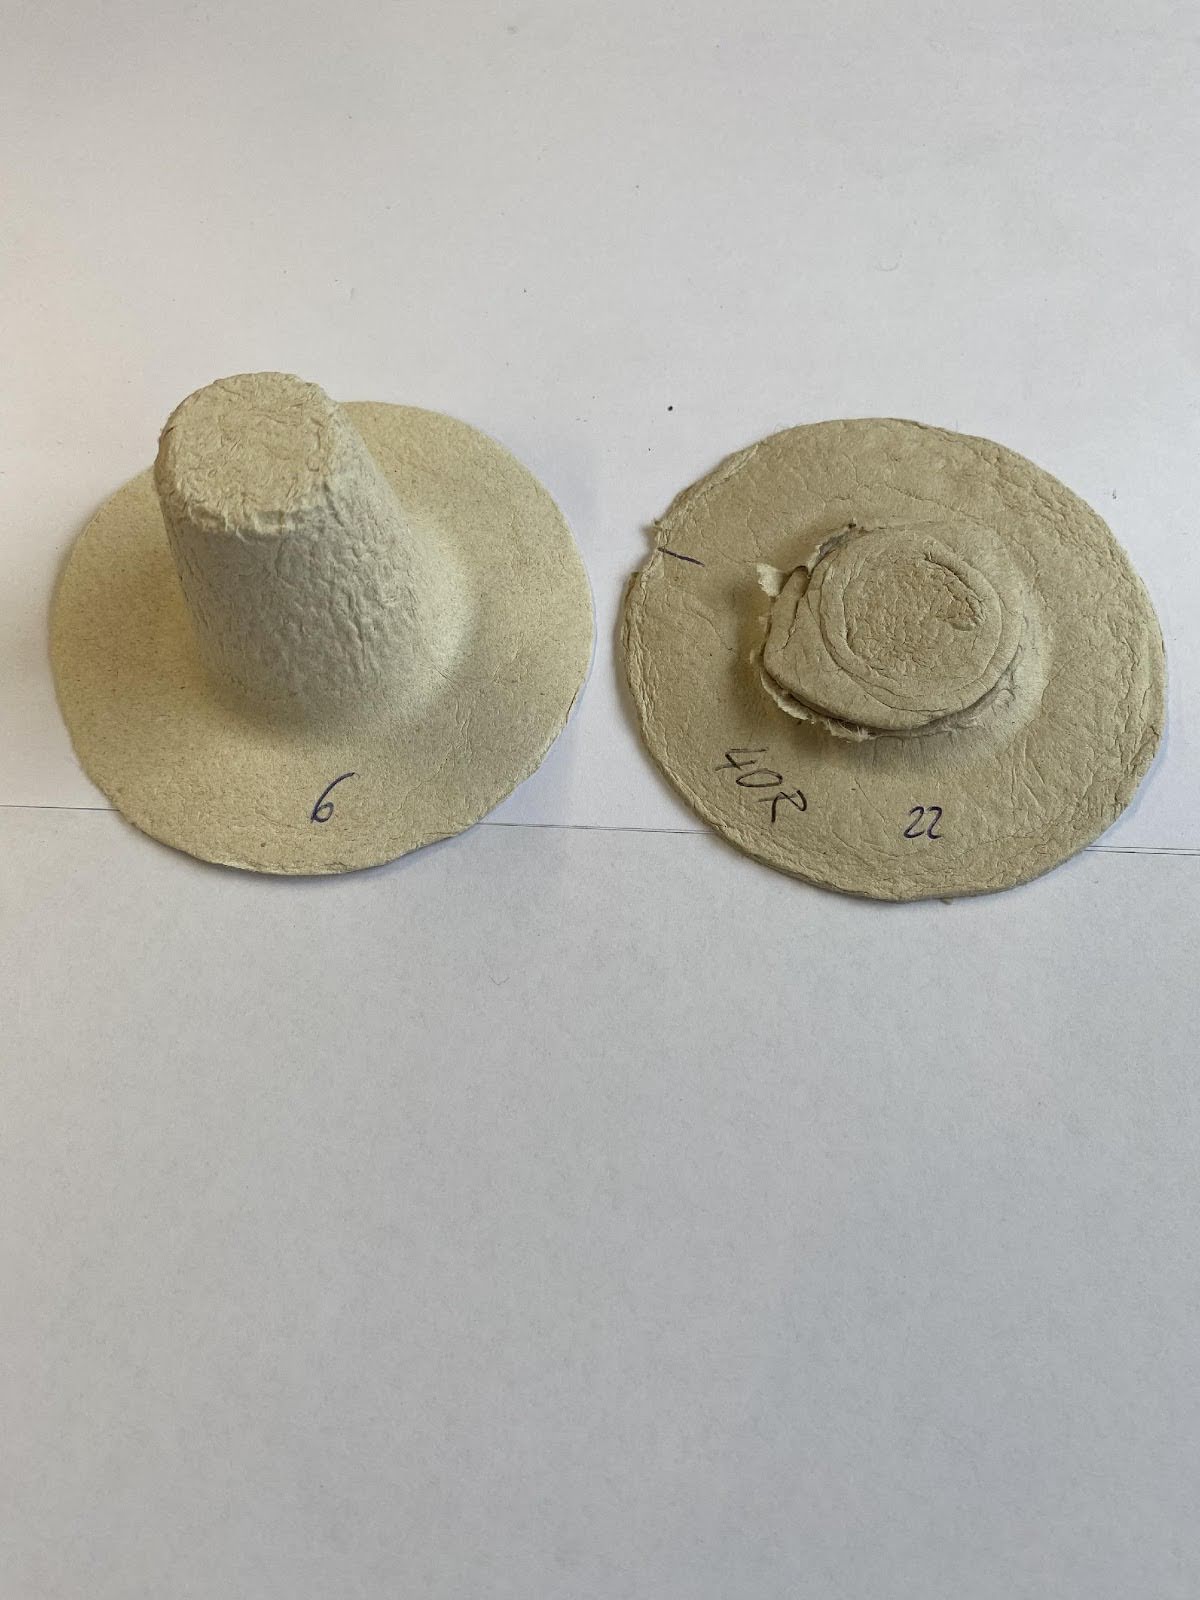
Free fall tests were conducted on a device we built ourselves in the Ladisk laboratory. The device is visible in the image and is largely composed of standard components. The device is assembled on a steel plate with a thickness of 12 mm. A rectangular frame made of standard square aluminum profiles with grooves is attached to it. Vertically from this frame, two identical profiles of 1500 mm in length are attached and connected together at the top crosswise. Linear guides are attached to these two upright profiles. Sliders that are connected to an aluminum plate slide along these guides. The uniqueness of the sliders is the operating principle, where there are no rolling elements. It is therefore just a sliding between guides made of anodized aluminum and special polymer plates that are installed in the sliders. This combination does not require lubrication and ensures quiet operation. In the middle of the connecting plate, an accelerometer is attached, with which we measure the acceleration process. As can be seen from the picture, weights are attached to this aluminum plate, which are screwed on and allow for a quick change of mass. The mass of both linear sliders together with the aluminum plate and weights is considered. The unit without added weights weighs 2200 g. There are weights of various masses available. In our case, we conducted free fall tests with six different masses, starting with the set without added masses. We added weights of 750 g. Therefore, the base mass was 2200 g, and the final was 5950 g. An aluminum plate with a thickness of 20 mm, which provides a rigid surface where test subjects are placed, is attached to the basic frame. As visible in the image, the entire device is placed on a movable granite block weighing around 500 kg. It is isolated from the surroundings via air dampers, to which wheels are attached. This greater mass allows the base to dampen vibrations caused by the impact of the mass on the test subjects.
The measuring chain for measurement is simple. The signal was captured with an accelerometer,
from which the voltage analog signal is transmitted to a card. This converts the analog signal into
digital, which then travels through a cable via the USB port to a computer. We used the PCB J320C03
accelerometer, with a sensitivity of 10.54 mV/g. It is an accelerometer that operates on the principle
of ICP (integrated circuit piezoelectric). Thus, mechanical vibrations cause mechanical loads on the
piezoelectric material in the accelerometer. As a result of these loads, a charge is generated.
A charge amplifier is also built into the accelerometer, so the sensitivity is given in units
of electrical voltage. The accelerometer also requires power, which is provided by the card performing A/D conversion.
The free fall tests were conducted from a height of 150 mm,
measured from the top of the basic shape samples to the connecting
aluminum plate. Thus, we were determining the damping curve for a height
of 150 mm. The static pressure between the upper surface and the
connecting plate was changed by changing the mass or weight. We
could have changed the surface area with unchanged mass, which
would mean that for each measurement we would test one more sample.
This would mean that for five different static pressures, we would have used 15 samples for one
mixture of fibers. Since we did not produce such a large number of samples, we decided to change
the mass. The data was displayed using the Labview program, where we captured the acceleration
signal in relation to time. For each measurement, we read the maximum acceleration. We used the
data of the maximum acceleration of each impact to draw the damping curves. With each change in mass,
we tested a new sample, as it was destroyed with one impact. Since we drew each damping curve based on
six measured points or six different static pressures, we used six samples of the basic shape. Each damping
curve was drawn twice, so we used a total of twelve samples for one mixture of fibers.